(FUVEST 2017 1° FASE)
Níveis per capita de industrialização, 1750-1913
(Reino Unido em 1900 = 100)
| País |
| 1750 | 1800 | 1860 | 1913 |
| Alemanha |
| 8 | 8 | 15 | 85 |
| Bélgica |
| 9 | 10 | 28 | 88 |
| China |
| 8 | 6 | 4 | 3 |
| Espanha |
| 7 | 7 | 11 | 22 |
| EUA |
| 4 | 9 | 21 | 126 |
| França |
| 9 | 9 | 20 | 59 |
| Índia |
| 7 | 6 | 3 | 2 |
| Itália |
| 8 | 8 | 10 | 26 |
| Japão |
| 7 | 7 | 7 | 20 |
| Reino Unido |
| 10 | 16 | 64 | 115 |
| Rússia |
| 6 | 6 | 8 | 20 |
Ronald Findlay e Kevin O’Rourke. Power and Plenty:
Trade, War, and the World Economy in the Second Millennium.
Princeton: Princeton University Press, 2007. Adaptado.
Com base na tabela, é correto afirmar:
Questões relacionadas
- Filosofia | 2.1 Pré-Socráticos
A harmonia do mundo como concebida pelos pitagóricos era, em certo sentido, uma harmonia estática, pois as relações matemáticas que a sustentavam tinham um caráter eterno, excluído ao tempo. Em nítido contraste com isso, e mais similarmente aos primeiros jônicos, Heráclito concebia uma harmonia dinâmica, que privilegiava o papel e a ubiquidade da mudança e da transformação, pelo jogo de tensões opostas. Esse movimento de privilégio, ora do componente estático, ora do dinâmico, será uma tônica de toda a filosofia grega pré e pós-socrática, e acabará por adquirir conotações não só metafísicas, mas também epistemológicas.
REALE, G.; ANTISERI, D. História da Filosofia. São Paulo: Paulus, 1990 (adaptado).
Os pré-socráticos, apesar das divergências conceituais, contribuíram para o surgimento da filosofia. Segundo Pitágoras, a arché, causa primeira de todas as coisas, seria o(a)
- Literatura | 4.1 Romantismo
(ENEM 2009 CANCELADO)
O sertão e o sertanejo
Ali começa o sertão chamado bruto. Nesses campos, tão diversos pelo matiz das cores, o capim crescido e ressecado pelo ardor do sol transforma-se em vicejante tapete de relva, quando lavra o incêndio que algum tropeiro, por acaso ou mero desenfado, ateia com uma faúlha do seu isqueiro. Minando à surda na touceira, queda a vívida centelha. Corra daí a instantes qualquer aragem, por débil que seja, e levanta-se a língua de fogo esguia e trêmula, como que a contemplar medrosa e vacilante os espaços imensos que se alongam diante dela. O fogo, detido em pontos, aqui, ali, a consumir com mais lentidão algum estorvo, vai aos poucos morrendo até se extinguir de todo, deixando como sinal da avassaladora passagem o alvacento lençol, que lhe foi seguindo os velozes passos. Por toda a parte melancolia; de todos os lados tétricas perspectivas. É cair, porém, daí a dias copiosa chuva, e parece que uma varinha de fada andou por aqueles sombrios recantos a traçar às pressas jardins encantados e nunca vistos. Entra tudo num trabalho íntimo de espantosa atividade.
Transborda a vida. TAUNAY, A. Inocência. São Paulo: Ática, 1993 (adaptado).
O romance romântico teve fundamental importância na formação da ideia de nação. Considerando o trecho acima, é possível reconhecer que uma das principais e permanentes contribuições do Romantismo para construção da identidade da nação é a
- Língua Portuguesa - Fundamental | Não Possui Tópico Definido
Cantiga
Senhora, partem tão tristes
meus olhos por vós, meu bem,
que nunca tão tristes vistes
outros nenhuns por ninguém.
Tão tristes, tão saudosos,
tão doentes da partida,
tão cansados, tão chorosos
da morte mais desejosos
cem mil vezes que da vida.
Partem tão tristes os tristes,
tão fora d’esperar bem,
que nunca tão tristes vistes
outros nenhuns por ninguém.
CASTELO-BRANCO, João Ruiz de. In: RESENDE, Garcia de. Antologia do Cancioneiro Geral.
Lisboa: Ulisseia, 1993, p. 84.
Nessa cantiga, o poeta utilizou alguns recursos de grande efeito expressivo, como a repetição de certas palavras. Leia as afirmações a seguir:
I. O verbo partir e o substantivo partida são modos mais suaves de se referir à morte.
II. No décimo verso, um adjetivo – tristes – é substantivado e substitui a palavra olhos.
III. Nos olhos se concentra todo o sentimento do eu lírico.
IV. Apesar da imensa tristeza, a última estrofe exprime alguma esperança de retorno.
Estão corretas apenas as afirmações:
- Biologia | 3.2 Carboidratos, Lipídios, Proteínas e Enzimas
Sabendo-se que as enzimas podem ter sua atividade regulada por diferentes condições de temperatura e pH, foi realizado um experimento para testar as condições ótimas para a atividade de uma determinada enzima. Os resultados estão apresentados no gráfico.
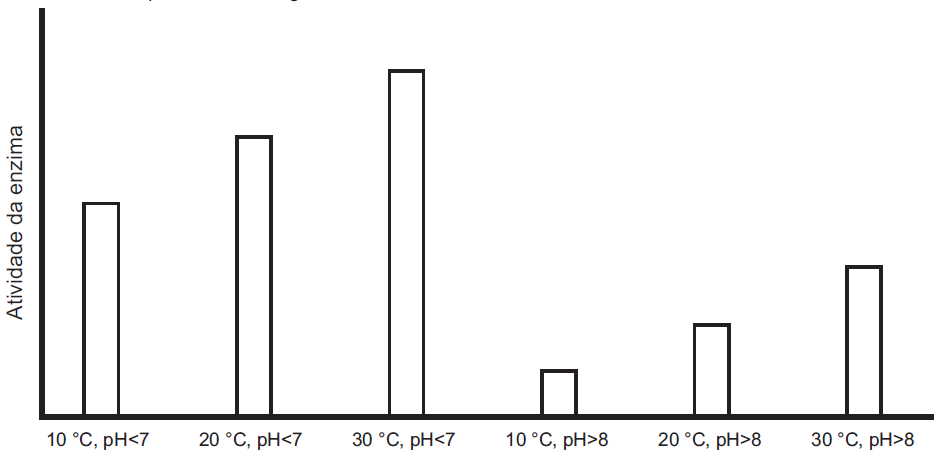
Em relação ao funcionamento da enzima, os resultados obtidos indicam que o (a):
- Geografia | A. Globalização

Com o intenso desenvolvimento da tecnologia no mundo contemporâneo, diversos produtos tomam-se rapidamente ultrapassados.
Todavia, comparando as imagens, existem elementos que demonstram a continuidade entre os primeiros computadores pessoais e os atuais.
Essa continuidade associa-se