(PUC-RS) Num laboratório, um grupo de alunos registrou o comprimento L de uma barra metálica, à medida que sua temperatura T aumentava, obtendo o gráfico abaixo:
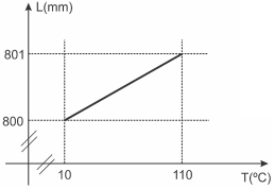
Pela análise do gráfico, o valor do coeficiente de dilatação do metal é
Questões relacionadas
- Língua Espanhola | 1. Interpretação de Textos
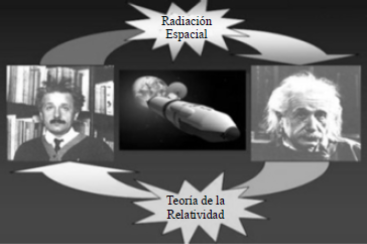
¿Un error de Einstein sobre el viaje espacial?
Pensemos en 1 un par de hermanos, gemelos
idénticos. Uno de ellos consigue un trabajo de astronauta y
se aventura por el espacio profundo. El otro permanece en la
[4] Tierra. Cuando el gemelo viajero regresa a casa, descubre
que es más joven que su hermano. Esta es la paradoja de los
gemelos de Einstein, y, aunque parezca extraño, es
[7] absolutamente correcta. La Teoría de la Relatividad nos dice
que cuanto más rápido se viaja en el espacio más lento se
viaja en el tiempo. Viajar a gran velocidad a la estrella Alpha
[10] Centauri sería, por lo tanto, una buena manera de permanecer
joven.¿O quizás no?
Algunos investigadores comienzan a creer que el
[13] viaje espacial podría tener el efecto contrario. Podría hacerte
prematuramente viejo. La Teoría de la Relatividad de Albert
Einstein dice que el tiempo se hace más lento para los
[16] rapidísimos viajeros espaciales, de hecho manteniéndolos
más jóvenes. La actuación de la radiación espacial sobre los
telómeros puede invertir este efecto.
[19] "El problema de la paradoja de Einstein es que no
tuvo en cuenta la biología, específicamente la radiación
espacial y la biología del envejecimiento", dice Frank
[22] Cucinotta, jefe científico de la NASA para estudios de
radiación en el Centro Espacial Johnson. Mientras que el
astronauta gemelo avanza por el espacio, explica Cucinotta,
[25] sus cromosomas están expuestos a los penetrantes rayos
cósmicos. Esto puede dañar sus telómeros — pequeñas
"tapas" moleculares en los extremos de su ADN. Aquí en la
[28] Tierra la pérdida de los telómeros está asociada al envejecimiento.
Hasta ahora el riesgo no ha sido una gran
preocupación. El efecto en los astronautas del Transbordador
[31] o de la Estación Espacial Internacional, si hubiera alguno,
sería muy pequeño. Los astronautas viajan en órbitas que se
encuentran dentro del campo magnético protector de la
[34] Tierra, el cual repele la mayoría de los rayos cósmicos. Pero
en el 2018 la NASA planea enviar humanos fuera de esta
burbuja protectora para regresar a la Luna y finalmente viajar
[37] a Marte. Los astronautas de estas misiones podrían estar
expuestos a los rayos cósmicos durante semanas o meses
seguidos. Naturalmente a la NASA le gustaría averiguar si
[40] existe realmente o no el peligro de envejecimiento por
radiación y, si existe, cómo prevenirlo.
La ciencia comienza a abordar el tema sólo ahora.
[43] "La realidad es que tenemos muy poca información sobre la
conexión entre la radiación y la pérdida de los telómeros",
comenta Jerry Shay, un biólogo celular del Centro Médico
[46] Suroeste de la Universidad de Texas en Dallas. Con el apoyo
de la NASA, Shay y otros colaboradores están estudiando el
problema. Lo que aprenden sobre envejecimiento podría
[49] beneficiar a cualquiera, en la Tierra y en el espacio.
Internet: (con adaptaciones).
Science@Nasa.
De acuerdo con las estructuras semánticas y gramaticales del texto, juzgue lo ítem subsiguiente.
La partícula se en “se aventura” (l.3) forma parte del verbo aventurar.
- História | 3.1 Espada e Oligárquica
Colhe o Brasil, após esforço contínuo dilatado no tempo, o que plantou no esforço da construção de sua inserção internacional. Há dois séculos formularam-se os pilares da política externa. Teve o país inteligência de longo prazo e cálculo de oportunidade no mundo difuso da transição da hegemonia britânica para o século americano. Engendrou concepções, conceitos e teoria própria no século XIX, de José Bonifácio ao Visconde do Rio Branco. Buscou autonomia decisória no século XX. As elites se interessaram, por meio de calorosos debates, pelo destino do Brasil. O país emergiu, de Vargas aos militares, como ator responsável e previsível nas ações externas do Estado. A mudança de regime político para a democracia não alterou o pragmatismo externo, mas o aperfeiçoou.
SARAIVA, J. F. S. O lugar do Brasil e o silêncio do parlamento.
Correio Braziliense, Brasília, 28 maio 2009 (adaptado).
Sob o ponto de vista da política externa brasileira no século XX, conclui-se que
- Língua Espanhola | 1. Interpretação de Textos
[1] La muerte se puede conceptuar como una
construcción que el hombre ha ido desarrollando a lo largo
de la historia y en diversas culturas de diferentes maneras.
[4] En el cristianismo, por ejemplo, se anuncia que con
la venida de Jesucristo tiene lugar la salvación de la
humanidad. Aunque bien es cierto que, todavía el ser
[7] humano debe recorrer un camino para su salvación. La
misma muerte de Jesucristo es símbolo de redención, muere
por amor a la humanidad, abriendo, con el magnífico
[10] sacrificio, un camino de liberación de los pecados de la
humanidad.
Las religiones orientales, en cambio, se caracterizan
[13] porque la salvación se produce de forma individual y no
colectiva. Existen mensajeros divinos pero estos no salvarían
a la humanidad sino que tan solo enseñarían a los individuos
[16] el camino de la salvación, camino que cada sujeto debería
recorrer individualmente mediante su esfuerzo.
El Islam considera que el mundo es un lugar donde
[19] Existe el sufrimiento como consecuencia de los errores
humanos. O mar, en la tierra puede haber tanto sufrimiento
como felicidad siendo el paraíso celestial el único lugar
[22] Donde habría felicidad verdadera, permanentemente. Luego,
la aspiración de un musulmán es abandonar el mundo para
alcanzar la dicha eterna. Y dentro de esta lógica la muerte es
[25] La puerta que le conducirá al paraíso.
En la antigüedad clásica había corrientes filosóficas
como el Estoicismo que preconizaban un estilo de vida
[28] sustentado por valores éticos. Los estoicos basaban la
felicidad en la posesión de un alma libre, a la que no alcanza
El dolor, ni es esclava de la búsqueda de una felicidad
[31] exterior, porque el hombre acaba encontrándola en sí mismo,al
ser libre de todas las pasiones. Creían que el hombre podía
alcandear dicho estado mediante una voluntad firme y
[34] constante, y que así, dueño de sí mismo, llegaría a ser
inacessível a la desgracia. Al morir el hombre se reuniría con
el espíritu universal. El estoico aceptaba la muerte y valores
[37] Como la Dignidad y Sobriedad Inclinaban a Aceptarla Con
naturalidade.
Carlos Álvarez Chicano. Bioética y Bioderecho, v. 7, 2002 (con adaptaciones).
Partiendo de su forma y función en el texto es correcto afirmar que
en la expresión "aceptarla" (l.37) el pronombre se refiere a "la muerte" (l.36).
- Biologia | 11.5 Sistema Nervoso
Um dos exames clínicos mais tradicionais para medir a capacidade reflexa dos indivíduos é o exame do reflexo patelar. Esse exame consiste na estimulação da patela, um pequeno osso localizado na parte anterior da articulação do joelho, com um pequeno martelo. A resposta reflexa ao estímulo é caracterizada pelo levantamento da perna em que o estímulo foi aplicado.
Qual região específica do sistema nervoso coordena essa resposta?
- Matemática | 4.2 Progressão Geométrica
(EBMSP)
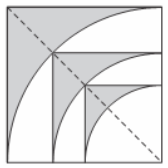
Na figura, tem-se a reprodução de parte de um painel em que cada região sombreada é interior a um quadrado e exterior a um quadrante de círculo inscrito no quadrado.
Sendo a medida do lado do quadrado maior igual a 4 u.c, as três regiões sombreadas totalizam uma área que mede k(4 - π) u.a, sendo o valor de k igual a: