O gráfico abaixo, retirado do Boletim Epidemiológico 16 de 2016 do Ministério da Saúde, registra os casos de dengue por semana, no Brasil, nos anos de 2014, 2015 e início de 2016.
.png)
Com base no gráfico, pode-se afirmar que
Questões relacionadas
- Língua Portuguesa | 1.02 Conhecimento Prévio
O nascimento da crônica
Há um meio certo de começar a crônica por uma trivialidade. É dizer: Que calor! Que desenfreado calor! Diz-se isto, agitando as pontas do lenço, bufando como um touro, ou simplesmente sacudindo a sobrecasaca. Resvala-se do calor aos fenômenos atmosféricos, fazem-se algumas conjeturas acerca do sol e da lua, outras sobre a febre amarela, manda-se um suspiro a Petrópolis, e La glace est rompue; está começada a crônica.
Mas, leitor amigo, esse meio é mais velho ainda do que as crônicas, que apenas datam de Esdras. Antes de Esdras, antes de Moisés, antes de Abraão, Isaque e Jacó, antes mesmo de Noé, houve calor e crônicas. No paraíso é provável, é certo que o calor era mediano, e não é prova do contrário o fato de Adão andar nu. Adão andava nu por duas razões, uma capital e outra provincial. A primeira é que não havia alfaiates, não havia sequer casimiras; a segunda é que, ainda havendo-os, Adão andava baldo ao naipe. Digo que esta razão é provincial, porque as nossas províncias estão nas circunstâncias do primeiro homem.
ASSIS, M. In: SANTOS, J .F. As cem melhores crônicas brasileiras. Rio de Janeiro: Objetiva, 2007 (fragmento).Um dos traços fundamentais da vasta obra literária de Machado de Assis reside na preocupação com a expressão e com a técnica de composição. Em O nascimento da crônica, Machado permite ao leitor entrever um escritor ciente das características da crônica, como:
- História | 6.14 Guerra Fria

“Nós somos muito felizes”
PHIL. Revista L’Espoirfrancais. França, 1935. Disponível em: https://ensinarhistoriajoelza.com.br. Acesso em 2 jul. 2021. VOT2021
A propaganda ideológica já vinha ocorrendo desde os anos de 1920, intensificou-se na década seguinte e, depois do fim da Segunda Guerra Mundial, ganhou uma dimensão global. Entre as razões para que a propaganda tenha se destacado no Ocidente tivemos a:
- Química | 2.4 Cinética Química
O sulfeto de mercúrio (II) foi usado como pigmento vermelho para pinturas de quadros e murais. Esse pigmento, conhecido como vermilion, escurece com o passar dos anos, fenômeno cuja origem é alvo de pesquisas. Aventou-se a hipótese de que o vermilion seja decomposto sob a ação da luz, produzindo uma fina camada de mercúrio metálico na superfície. Essa reação seria catalisada por íon cloreto presente na umidade do ar.
WOGAN, T. Mercury's Dark Influence on Art. Disponível em: www.chemistryworld.com. Acesso em: 26 abr. 2018 (adaptado).
Segundo a hipótese proposta, o íon cloreto atua na decomposição fotoquímica do vermilion:
- História | 3.1 Espada e Oligárquica
Enfermo a 14 de novembro, na segunda-feira o velho Lima voltou ao trabalho, ignorando que no entretempo caíra o regime. Sentou-se e viu que tinham tirado da parede a velha litografia representando D. Pedro de Alcântara. Como na ocasião passasse um contínuo, perguntou-lhe:
— Por que tiraram da parede o retrato de Sua Majestade?
O contínuo respondeu, num tom lentamente desdenhoso:
— Ora, cidadão, que fazia ali a figura do Pedro Banana?
— Pedro Banana! — repetiu raivoso o velho Lima.
E, sentando-se, pensou com tristeza:
— Não dou três anos para que isso seja uma República!
AZEVEDO, A. Vidas alheias. Porto Alegre: s.e, 1901 (adaptado).
A crônica de Artur Azevedo, retratando os dias imediatos à instauração da República no Brasil, refere-se ao(à)
- Matemática | 3.3 Quadrática ou 2° Grau
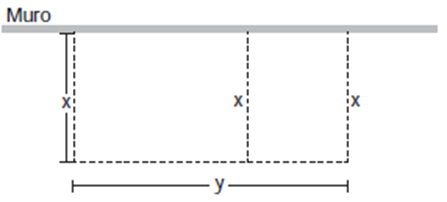
Para cultivar plantações de culturas diferentes e mantê-las protegidas dos animais da propriedade, um fazendeiro contratou um mestre de obras a fim de cercar a área dividindo-a em duas regiões. No intuito de economizar material a pedido do proprietário, o mestre de obras elaborou um projeto no qual usaria um muro retilíneo de alvenaria já existente na propriedade como um dos lados das regiões e utilizaria cerca para separar as regiões e protegê-las, de maneira que a área cercada fosse a máxima possível.
A figura a seguir mostra como ficará a separação das regiões, em que as partes pontilhadas representam a cerca, e os lados de mesma medida x são paralelos entre si e perpendiculares ao muro e ao lado de medida y.

Ao realizar o levantamento sobre o material disponível, o mestre de obras comprou 720 m de tela, sabendo que essa quantidade era suficiente para cercar toda a área das plantações e separar as regiões.
Se todo esse material for utilizado, a diferença, em metro, entre a medida de y e x que proporcionará a maior área cercada é