O gráfico a seguir representa uma função de 1.º grau do tipo y = ax + b. 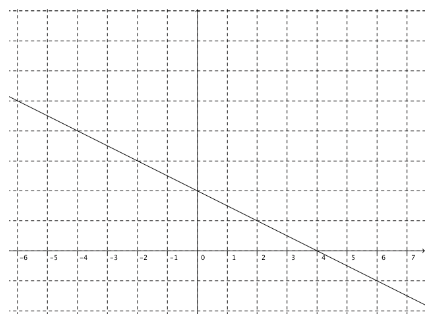
Fazendo-se o estudo de sinais dessa função, conclui-se que
Questões relacionadas
- Biologia
(PUC-CAMP) A compostagem é um processo biológico controlado que consiste na transformação de resíduos orgânicos em húmus. Dele participam diversos tipos de microorganismos e também vermes como a minhoca.Na vermicompostagem as minhocas são usadas para digerir matéria orgânica, melhorando o arejamento e a drenagem do material. O habitat natural ideal para as minhocas é, em geral, aquele apresentado pelos solos úmidos, porosos, fofos, nitrogenados, ligeiramente alcalinos, que contenham reservas de nutrientes formados pela decomposição de vegetais ou de outros materiais. Bastam-lhes 3 mg/L de O2 para que vivam e proliferem. Preferem temperaturas entre 12 °C e 25 °C. Em solos encharcados, fogem para a superfície, não pela presença excessiva de água, mas pela falta de oxigênio; o CO2 liberado não consegue dissipar-se no exterior devido à camada líquida que o retém.
As minhocas são animais
- Matemática - Fundamental | 05. Expressões Algébricas I
Um reservatório já está com 200 litros de água. Se for aberta uma torneira que despeja 25 litros de água por minuto, resolva cada item a seguir:
a) Escreva uma expressão algébrica que represente o número de litros de água (L) no reservatório após (t) minutos com a torneira aberta.
b) Calcule a quantidade de água no reservatório após 12 minutos com a torneira aberta.
- Língua Portuguesa | 1.2 Percepção das Ideias do Texto
Os smartphones estão sugando a sua produtividade. Você abriria mão deles?
Telefones inteligentes drenam nossa atenção mesmo quando desligados. E isso não é nada bom para a sua carreira. Pesquisadores e empresas tentam achar uma solução para o problema.
Funcionários estão distraídos com seus smartphones, browsers web, aplicativos de mensagem, sites de compras e muitas redes sociais.
Os trabalhadores distraídos são improdutivos. Uma pesquisa da CareerBuilder descobriu que os gerentes de contratação acreditam que os funcionários são extremamente improdutivos e mais da metade desses gerentes acreditam que os smartphones são culpados.
Alguns empregadores disseram que os smartphones degradam a qualidade do trabalho, diminuem a moral, interferem no relacionamento entre chefe e empregado e fazem com que os funcionários percam os prazos. (Os funcionários entrevistados discordaram e apenas 10% disseram que os telefones prejudicam a produtividade durante o horário de trabalho.)
A única solução é uma combinação entre treinamento, educação e melhor gerenciamento.
Os departamentos de RH devem procurar um problema maior: a distração extrema do smartphone pode significar que os funcionários estão completamente desativados do trabalho. Os motivos para isso devem ser identificados e abordados.
A pior “solução” é a negação.
ELGAN, M. Disponível em: http://idgnow.com.br. Acesso em: 24 ago. 2017 (adaptado).
Ao expor um problema contemporâneo do mercado de trabalho e apontar uma solução, o texto evidencia a
- Espanhol - Fundamental | Não Possui Tópico Definido
http://img.limao.com.br/fotos/CB/D8/B2/CBD8B255B9DF40B98DC13A4997829FBC.jpg
Prepara el INBA "Pasaporte al Arte" para adolescentes
La institución prevé poner en marcha el próximo año un programa similar a "Pasaporte del Arte" para niños, pero ahora enfocado a los adolescentes, reveló su directora, Teresa Vicencio.
El Instituto Nacional de Bellas Artes prevé poner en marcha el próximo año un programa similar a "Pasaporte del Arte", pero ahora enfocado a los adolescentes, reveló su directora, Teresa Vicencio, al clausurar de manera oficial dicho programa infantil, en la Plaza Ángel Salas del Centro Cultural del Bosque (CCB).
En el acto, la funcionaria manifestó su preocupación por aquellos niños que año tras año participan en el programa, pero que con el paso del tiempo se convierten en adolescentes, imposibilitándolos para volver al mismo.
"Sabemos que el programa tiene una edad límite y de pronto nos preguntamos qué vamos hacer con los niños que ya no son tan niños y que están creciendo; por ello las próximas ediciones tendremos un programa para los adolescentes, con la idea de acércalos a las diferentes manifestaciones artísticas", dijo.
Vicencio expresó su beneplácito por el cierre de esta edición dedicada al Bicentenario de la Independencia y Centenario de la Revolución.
"Es un motivo de satisfacción haber contado con la participación entusiasta de poco más de dos mil 300 niñas y niños de entre 6 y 12 años de edad que participaron en la segunda temporada del programa Pasaporte del Arte 2009. Te lleva al Bicentenario, con el que buscamos acercarlos al arte y descubrir nuestro patrimonio cultural mediante el juego, la creatividad y la fantasía", indicó.
El programa "Pasaporte del Arte" cerró con broche de oro su segunda temporada 2009 e invitó a las compañías Dúo Ross, Coquín y su mundo mágico, La gran pompa y La Trouppé, para ofrecer a los niños y sus papás una jornada de diversión y esparcimiento.
La jornada final, que comenzó desde temprana hora, transcurrió en un ambiente de algarabía, música, colores y ritmos musicales que hicieron que el público disfrutara de los espectáculos, principalmente de "La fábula de la vaca", que quería volar y correr, a cargo de La gran pompa.
Ante más de mil 500 personas, en su mayoría familias completas con los niños que participaron en el programa citado, la funcionaria destacó las actividades que realizaron los menores en el tiempo de vigencia de su pasaporte, con el que pudieron ingresar a museos, galerías y teatros de esta capital.
"Estoy segura de que Pasaporte del Arte, ha contribuido a sembrar en los niños el germen de una nueva pasión: la que nace de la efervescencia interior que nos producen los sonidos de un instrumento; el movimiento del cuerpo de los bailarines; los intensos colores de los murales y de la pintura de caballete o la pasión de quienes actúan y representan un personaje", expresó.
Tras el acto, "La Trouppé" estrenó su espectáculo "Sketcheando" un show teatral con el que apelan a la imaginación de los niños.
Caracterizados como payasos y magos, esta agrupación uno de los más antiguos de teatro para niños, ofreció un recorrido integrado por 10 "sketches", mismos que forman parte de su repertorio teatral.
A través de la pantomima, el "clown" y títeres, cautivaron la atención de decenas de pequeños en un ambiente lleno de risas, gritos y mucha diversión.
"No se trata de cuentos o historias, sino un espectáculo donde los niños juegan, a partir del carácter lúdico de cada uno de los ïsketchesï", dijo a Notimex Mauro Mendoza, director de la compañía.
"La corrida de toros", "La opera", "El látigo", "El periódico", "El equilibrista", fueron algunos de los números que presentó está compañía, de la mano de sus cuatro integrantes: Silvia Guevara, Carmen Luna, Marco Antonio Serna y el propio Mauro Mendoza.
La idea, señaló Mendoza, es apelar a la imaginación y creatividad de los niños a través del juego, sobre todo ahora en tiempos en los que estos juegos con pies y manos ya no son tan conocidos y están siendo remplazados por el video juego.
http://www.milenio.com/node/309395
(A) ¿Cuál es tu relación con el arte?
(B) ¿Participarías de un programa como el Pasaporte del Arte? ¿Por qué?
- Arte | 6.4 Tendências Contemporâneas

A escultura do artista construtivista Amílcar de Castro é representativa da arte contemporânea brasileira e tem o traço estrutural marcado por elementos como