Considere a figura abaixo, que apresenta as principais porções do sistema digestório. A tabela mostra o gradiente de pH e a biomassa bacteriana em algumas destas porções, listadas em ordem aleatória

Local | Gradiente de pH | Biomassa bacteriana (células/mL) |
jejuno | 7,0 - 9,0 | 104-5
|
cólon | 5,0 - 7,0 |
1011
|
íleo | 7,0 - 8,0 |
108
|
estômago | 1,5 - 5,0 |
102-3
|
duodeno | 5,0 - 7,0 |
103-4
|
A partir das informações apresentadas, é correto afirmar:
Questões relacionadas
- Sociologia | 3. Trabalho e Produção
(Unesp) A crise de abastecimento de água em São Paulo se agravou significativamente a partir de 2002, quando a empresa pública Sabesp passou a priorizar a obtenção de lucro. Com essa alteração, a água deixou de ser considerada bem público e recurso essencial para a sociedade, abandonando-se o foco na universalização dos serviços de saneamento básico. Nesse mesmo caminho, seguiu uma diretriz estratégica de atender à expansão econômica, beneficiando-se com a lucratividade do aumento do consumo, ignorando a suficiência de água para atender a essa crescente demanda. Do ponto de vista neoliberal, a crise hídrica oferece “grandes e novas oportunidades” de negócios, tanto para obras como para serviços, especialmente no setor de gestão das águas, uma vez que se trata de um bem essencial de que todos são obrigados a dispor a qualquer preço e custo.
Delmar Matteret al. “As obras e a crise de abastecimento”. www.diplomatique.org.br, 06.02.2015. Adaptado.
No texto, o problema do abastecimento de água em São Paulo é abordado sob o ponto de vista...
- Matemática - Fundamental | 08. Problemas com Adição e Subtração
Uma grande loja na internet está fazendo uma megaliquidação. Leia os preços de promoção de alguns produtos e resolva
O medidor de pressão e a cadeira para automóvel estão sendo vendidos na promoção pela metade do preço. Ao final da promoção, eles voltarão ao seu preço normal. Quanto pagará uma pessoa que quiser comprar esses dois produtos, depois que a promoção acabar?
- Biologia | 12.8 Impactos Ambientais
Trata-se de fenômeno produzido pela queima de combustíveis fósseis (petróleo, gás natural e carvão), produção de cimento e outros produtos e pela mudança no uso do solo (substituição de florestas por pastagens e agricultura).
(Terezinha de Jesus Soares e Niro Higuchi. A convenção do clima e a legislação brasileira pertinente, 2006. Adaptado.)
O texto refere-se ao fenômeno conhecido como
- Língua Portuguesa - Fundamental | Não Possui Tópico Definido
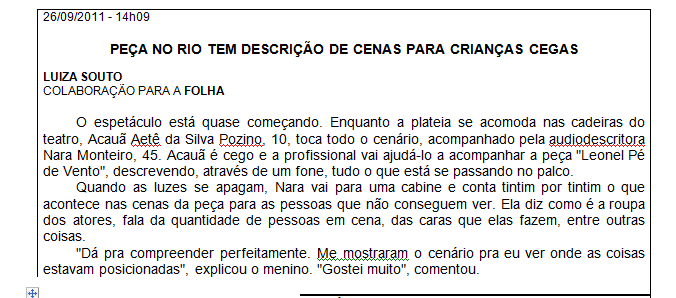
Imagine que você foi ao teatro assistir à peça “Leonel Pé de Vento” na mesma apresentação que o menino Acauã, citado no texto. Gostou tanto do tratamento dado ao menino que resolveu registrar tudo no seu diário. Tomando como ponto de partida as informações da notícia, escreva uma página de diário contando sobre sua ida ao teatro.
- História - Fundamental | 02. A vida familiar
Sobre as escolas de hoje no Brasil podemos afirmar que