. Texto base: 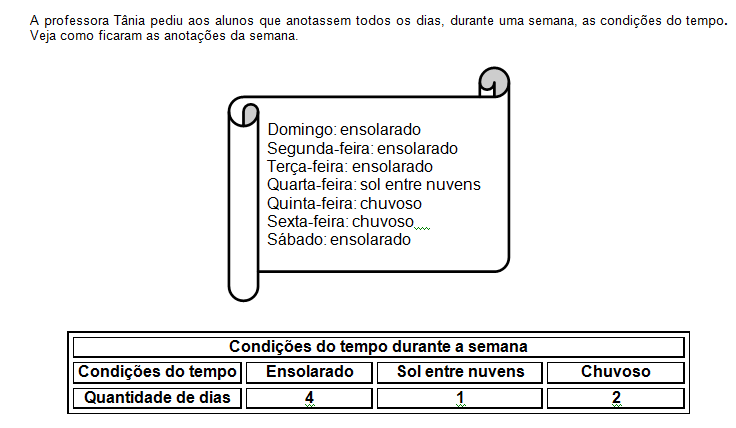
Enunciado:
De acordo com as anotações da professora,
Questões relacionadas
- Biologia | 13.9 Linkage
(UPE) A meiose é um tipo de divisão celular, que persiste entre os seres vivos como um mecanismo gerador de variabilidade e uma consequente evolução biológica. Assinale a alternativa que indica a fase da divisão celular de acordo com o que é observado na célula e que garante essa possibilidade de diversidade. 
- Geografia | 4. Formação Territorial do Brasil
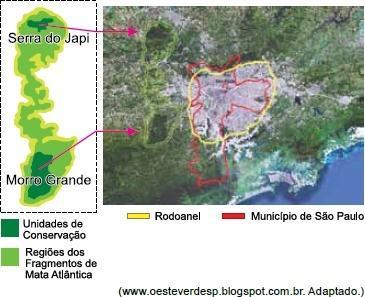
Analise a imagem de satélite.
Caracteriza um instrumento de gestão e de ordenamento territorial, legalmente definido pelo Sistema Nacional de Unidades de Conservação da Natureza com o objetivo de garantir a integridade dos processos ecológicos nas áreas de ligação entre unidades de conservação. É uma estratégia fundamental para evitar os prejuízos ecológicos proporcionados pelo isolamento das áreas naturais protegidas em meio à malha urbana e rural.
(www.icmbio.gov.br. Adaptado.)
- Biologia | 12.1 Conceitos Básicos
(G1 - IFCE) Observe a seguinte ilustração.
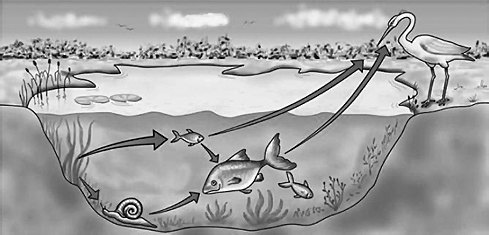
Analisando-se todos os elementos contidos na imagem e considerando-se os conceitos de níveis de organização em biologia, a figura representa
- Química | 3.2 Hidrocarbonetos
Os haletos orgânicos são muito utilizados como solventes na fabricação de plásticos, inseticidas e gás de refrigeração. Assinale a opção que associa corretamente a fórmula estrutural do haleto orgânico com seu nome IUPAC.
- Física | A. Escalar
(UNIT)
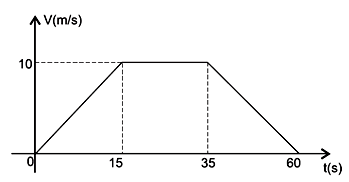
A figura representa o gráfico da variação da velocidade em função do tempo de um trem que se desloca de uma estação à outra.
Nessas condições, é correto afirmar que a velocidade média desenvolvida pelo trem é, em m/s, aproximadamente igual a