Os gráficos da figura apresentam as evoluções da capacidade de atendimento e da demanda máxima instantânea de energia elétrica em um país fictício no período de 2005 a 2015.

Analisando esses gráficos, é verdadeiro afirmar que:
Questões relacionadas
- História | 1.1 Pré-Colonial
De ponta a ponta, é tudo praia-palma, muito chã e muito formosa. Pelo sertão nos pareceu, vista do mar, muito grande, porque, a estender olhos, não podíamos ver senão terra com arvoredos, que nos parecia muito longa. Nela, até agora, não pudemos saber que haja ouro, nem prata, nem coisa alguma de metal ou ferro; nem lho vimos. Porém a terra em si é de muito bons ares [...]. Porém o melhor fruto que dela se pode tirar me parece que será salvar esta gente.
Carta de Pero Vaz de Caminha. In: MARQUES, A.; BERUTTI, F.; FARIA, R. História moderna através de textos. São Paulo: Contexto, 2001.
A carta de Pero Vaz de Caminha permite entender o projeto colonizador para a nova terra. Nesse trecho, o relato enfatiza o seguinte objetivo:
- Geografia | B. Blocos Econômicos
Em 7 de fevereiro de 1992 foi assinado na cidade holandesa de Maastricht um tratado que recebeu o seu nome, o Tratado de Maastricht. Este representou um marco na união da Europa, fixando a integração econômica e consequente unificação política. Sobre esse tratado, é incorreto afirmar-se que
- História - Fundamental | 05.3. Registros da história: a nossa cultura
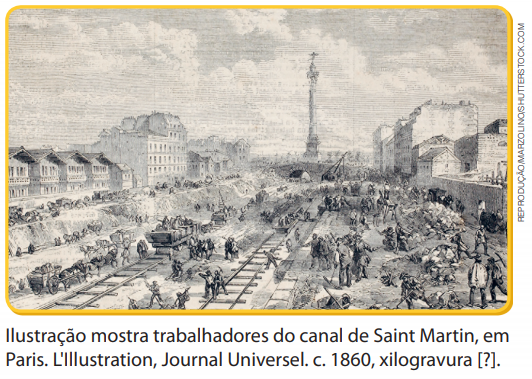
Observe a imagem a seguir. Depois, responda o que se pede.
A mão de obra escrava era a base da economia brasileira durante o Segundo Reinado. Mas a economia começava a mudar. Qual a importância da ferrovia nessa época?
- Biologia | 4.3 Metabolismo Energético
(UNIT) Uma das maiores reviravoltas na evolução foi a transformação de uma forma de poluição atmosférica, anteriormente fatal — o oxigênio —, num recurso cobiçado. Longe de destruir o planeta, o oxigênio o energizou.
(MARGULIS; SAGAN. 2002. p. 119)
A respeito dos processos metabólicos envolvidos com a presença, a transformação e a energização da biosfera pelo oxigênio molecular (O2), é correto afirmar:
- Geografia | A. Globalização
O intercâmbio de ideias, informações e culturas, através dos meios de comunicação, imprimem mudanças profundas no espaço geográfico e na construção da vida social, na medida em que transformam os padrões culturais e os sistemas de consumo e de produção, podendo ser responsáveis pelo desenvolvimento de uma região.
HAESBAERT, R. Globalização e fragmentação do mundo contemporâneo.Rio de Janeiro: EdUFF, 1998.
Muitos meios de comunicação, frutos de experiências e da evolução científica acumuladas, foram inventados ou aperfeiçoados durante o século XX e provocaram mudanças radicais nos modos de vida, como por exemplo,