A figura a seguir representa o gráfico das funções de 1.º grau f(x) e g(x). 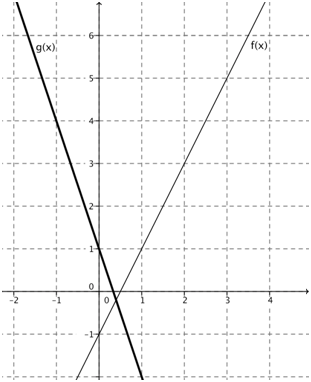
De acordo com o gráfico,
Questões relacionadas
- Matemática - Fundamental | 11. Áreas e Volumes
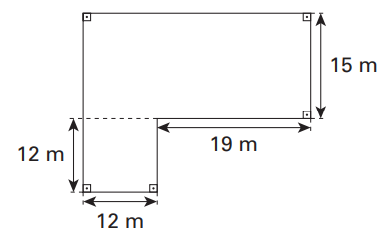
Paulo adquiriu um terreno para construir sua casa. Para que pudesse elaborar o projeto da construção, o engenheiro responsável pela obra desenhou um esboço desse terreno, mostrado a seguir.
Qual é a área do terreno comprado por Paulo?
- Ciências - Fundamental | Não Possui Tópico Definido
Observe a tabela com a porcentagem de domicílios ligados à rede de distribuição de água tratada e de coleta de esgoto por região do Brasil.
De acordo com a tabela,
- Matemática - Fundamental | 2.2 Movimentação, Mapas e Caminhos Orientados
A figura seguinte mostra um retângulo com as medidas de seus lados, que são as ruas de um quarteirão numa cidade.
Observa-se que em cada ponta (vértice) do retângulo estão representadas as casas de quatro pessoas. Com essas informações, responda.
a) Para ir até a casa de Felipe, João caminhou de sua casa até a casa de Alice. Em seguida, andou até a casa de Marina e depois foi até a casa de Felipe. Quantos metros ele caminhou nesse trajeto fazendo o menor percurso possível?
b) Se ele tivesse saído de sua casa e caminhado direto até a casa de Felipe pelo trajeto mais curto, quantos metros a menos ele caminharia?
- Matemática | 09. Probabilidade
(FMP) Um grupo é formado por três homens e duas mulheres. Foram escolhidas, ao acaso, três pessoas desse grupo. Qual é a probabilidade de as duas mulheres do grupo estarem entre as três pessoas escolhidas?
- Matemática | 1.01 Quatro Operações Fundamentais e Expressões Numéricas
O Sr. Fernando comprou um terreno retangular que mede 18 metros de largura por 30 metros de comprimento. Para cercar completamente sua propriedade, ele comprou estacas de madeira e rolos de arame farpado. A pessoa contratada para fazer o serviço sugeriu que fossem colocados cinco fios de arame contornando todo o perímetro, conforme a figura.
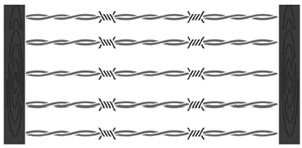
Fernando acatou a sugestão. Sabendo que o arame farpado é vendido em rolos de 50 metros, determine quantos rolos, no mínimo, serão comprados.