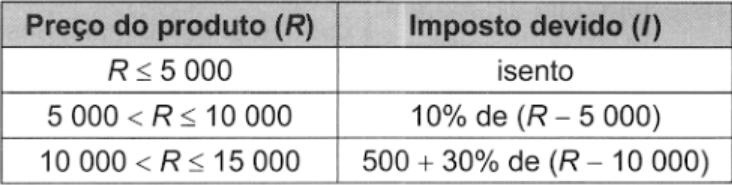
O quadro representa a relação entre o preço de um produto (R) e seu respectivo imposto devido (I).
Questões relacionadas
- Língua Portuguesa | 1.2 Percepção das Ideias do Texto
(FUVEST 2018 1ª FASE) Examine o cartum.
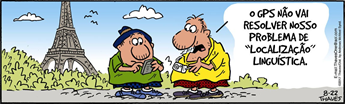
Frank e Ernest – Bob Thaves. O Estado de S. Paulo. 22.08.2017.
O efeito de humor presente no cartum decorre, principalmente, da
- Geografia | A. Globalização
(ACAFE) “E comum um telefone celular ir ao lixo com menos de oito meses de uso ou uma impressora nova durar apenas um ano. Em 2005, mais de 100 milhões de telefones celulares foram descartados nos Estados Unidos. Uma CPU de computador, que nos anos 1990 durava até sete anos, hoje dura dois anos. Telefones celulares, computadores, aparelhos de televisão, câmeras fotográficas caem em desuso e são descartados com uma velocidade assustadora. Bem-vindo ao mundo da obsolescência planejada”.
Fonte: Revista Fórum, número 74, setembro de 2013.
A partir da leitura do texto acima, assinale a alternativa correta.
- História
Observe a figura.
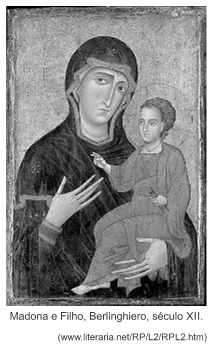
O ícone, pintura sobre madeira, foi uma das manifestações características da Civilização Bizantina, que abrangeu amplas regiões do continente europeu e asiático. A arte bizantina resultou
- Língua Portuguesa - Fundamental | 08. Verbo
Texto base: Leia o texto "Você e a biodiversidade" para responder a questão.
Você e a biodiversidade
Abra a janela de sua casa e tente enxergar cada uma das partes que compõem a paisagem. Perceba como a vida está presente em cada elemento. E como todos juntos, com suas diferenças, formam um todo, um sistema interligado em que cada indivíduo exerce um papel importante para manter o equilíbrio geral. Essa variedade de vidas é a biodiversidade, da qual você faz parte.
Agora, imagine
Se todas as árvores fossem derrubadas. Para onde iriam os pássaros? Como se alimentariam ou encontrariam abrigo da chuva? Se os rios e mares estivessem totalmente poluídos. Como os peixes e as outras espécies que vivem na água sobreviveriam? Se as abelhas desaparecessem da Terra. Quantas plantas seriam extintas? Disponível em: http://www.natura.podbr.com/p/biodiversidade/biodiversidade.html. Acesso em 13 jan. 2012.
Enunciado:
(A) Na primeira parte do texto, predominam verbos no modo imperativo. São eles: abra, tente, perceba.
Justifique a importância desses verbos para a construção de sentido do texto.
(B) Na segunda parte do texto: "Agora, imagine.", alguns verbos estão no pretérito imperfeito do subjuntivo: fossem, estivessem, desaparecessem.
Justifique a utilização do modo subjuntivo nesta parte do texto
- Sociologia | 6 Sociologia Brasileira
(UNICAMP) As feridas da discriminação racial se exibem ao mais superficial olhar sobre a realidade social do país. Até 1950, a discriminação em empregos era uma prática corrente, sancionada pelas práticas sociais do país. Em geral, os anúncios de vagas de trabalho eram publicados com a explícita advertência: “não se aceitam pessoas de cor.” Mesmo após a Lei Afonso Arinos, de 1951, proibindo categoricamente a discriminação racial, tudo continuou na mesma. Depois da lei, os anúncios se tornaram mais sofisticados que antes, e passaram a requerer: “pessoas de boa aparência”. Basta substituir “pessoas de boa aparência” por “branco” para se obter a verdadeira significação do eufemismo.
(Adaptado de Abdias do Nascimento, O genocídio do negro brasileiro: processo de um racismo mascarado. São Paulo: Perspectiva, 2018, p. 97.)
A partir do excerto, é correto afirmar: