(UEG) No gráfico a seguir, é apresentada a variação da energia durante uma reação química hipotética.
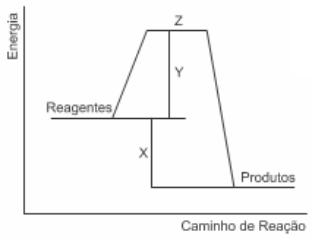
Com base no gráfico, pode-se correlacionar X, Y e Z, respectivamente, como:
Questões relacionadas
- Biologia
O filo porífera tem representantes no ambiente marinho e na água doce, podendo viver isoladamente ou em colônias. Apresenta estrutura corpórea simples, não possui órgãos diferenciados e sim tipos diferenciados de células, tais como os pinacócitos e os coanócitos.
Essas células têm como função, respectivamente.
- História | 6.08 Imperialismo
(UFSM)
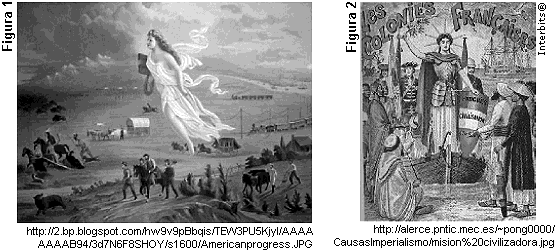
Na pintura de John Gast (Figura 1), Colúmbia, a mulher angelical, carrega a "luz da civilização" para iluminar os caminhos e guiar homens e carroças na marcha para o oeste dos Estados Unidos; enquanto ela avança e expande os cabos do telégrafo nos caminhos por onde passa, tanto os indígenas nativos como os animais selvagens fogem amedrontados.
No centro do cartaz (Figura 2), a mulher com armadura (uma referência à heroína Joana d'Arc) traz, na mão direita erguida, um ramo de oliveira, símbolo da sabedoria universal; a mão esquerda segura o escudo com as cores da bandeira francesa e o lema "progresso - civilização - comércio". É a alegoria da França conquistadora que se expande para a Ásia e África distantes, levando as luzes do progresso e do comércio para os povos que, por desconhecerem o majestoso brilho da civilização europeia, vivem na escuridão.
Essas imagens são alegorias de duas ideologias imperialistas do século XIX sintetizadas, respectivamente, nas expressões históricas.
- Língua Portuguesa | 1.08 Figuras de Linguagem
(EPCAR) _ Em 1855, o cacique Seattle, da tribo Suquamish, do Estado de Washington, enviou esta carta ao presidente dos Estados Unidos (Francis Pierce), depois de o Governo haver dado a entender que pretendia comprar o território ocupado por aqueles índios. Faz mais de um século e meio. Mas o desabafo do cacique tem uma incrível atualidade.
“(...) De uma coisa sabemos, que o homem branco 1talvez venha a um dia descobrir: 2o nosso Deus é o mesmo Deus. 3Julga, talvez, que pode ser dono Dele da mesma maneira como deseja possuir a nossa terra. Mas não pode. Ele é Deus de todos. E quer bem da mesma maneira ao homem vermelho como ao branco. A terra é amada por Ele. Causar dano à terra é demonstrar desprezo pelo Criador. O homem branco também vai desaparecer, 4talvez mais depressa do que as outras raças. 5Continua sujando a sua própria cama e há de morrer, uma noite, sufocado nos seus próprios dejetos. Depois de abatido o último bisão e domados todos os cavalos selvagens, 6quando as matas misteriosas federem à gente, quando as colinas escarpadas se encherem de fios que falam, onde ficarão então os sertões? Terão acabado. E as águias? Terão ido embora. Restará dar adeus à andorinha da torre e à caça; 7o fim da vida e o começo da luta pela sobrevivência. (...)
8Talvez compreendêssemos com que sonha o homem branco se soubéssemos quais as esperanças transmite a seus filhos nas longas noites de inverno, quais visões do futuro oferecem para que possam ser formados os desejos do dia de amanhã. Mas nós somos selvagens. Os sonhos do homem branco são ocultos para nós. E por serem ocultos temos que escolher o nosso próprio caminho. Se consentirmos na venda é para garantir as reservas que nos prometeste. Lá talvez possamos viver os nossos últimos dias como desejamos. Depois que o último homem vermelho tiver partido e a sua lembrança não passar da sombra de uma nuvem a pairar acima das pradarias, a alma do meu povo continuará a viver nestas florestas e praias, 9porque nós as amamos como um recém-nascido ama o bater do coração de sua mãe. Se te vendermos a nossa terra, ama-a como nós a amávamos. 10Protege-a como nós a protegíamos. Nunca esqueça como era a terra quando dela tomou posse. E com toda a sua força, o seu poder, e todo o seu coração, 11conserva-a para os seus filhos, e ama-a como Deus nos ama a todos. Uma coisa sabemos: o nosso Deus é o mesmo Deus. Esta terra é querida por Ele. Nem mesmo o homem branco pode evitar o nosso destino comum.”
www.culturabrasil.pro.br/seattle1.htm. Acesso em 16/04/2016.
Observe os trechos destacados e as análises apresentadas. Assinale a alternativa que contém uma classificação e/ou uma análise INCORRETA da(s) figura(s) de linguagem:
- Física | 3.1 Termometria
(CPS) O uso do chuveiro elétrico representa uma parcela significativa do gasto com energia elétrica em uma casa. Nos dias de maior insolação, este gasto pode ser diminuído com o uso de aquecedores solares de água.
Um modelo simples e de baixo custo, construído com garrafas plásticas de refrigerante e caixas de leite, substitui com bastante eficiência painéis solares produzidos industrialmente.
Observe a fotografia de um desses painéis em que sua capacidade de aquecimento está sendo testada.
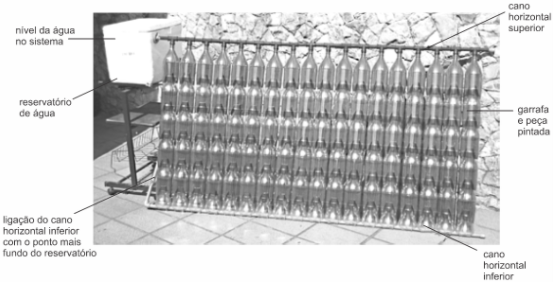
Nessa construção, dezoito canos de PVC, dispostos um ao lado do outro, estão conectados em seus extremos por dois canos horizontais. Cada um dos dezoito canos é envolvido por garrafas com o fundo cortado. Dentro de cada garrafa há uma peça obtida do corte de embalagens de leite, pintada na cor preto-fosco. Desempenhando a função de reservatório de água, foi usada uma caixa de isopor.
Os dois canos horizontais estão em alturas diferentes e ambos se conectam ao reservatório de água. O cano horizontal superior se conecta ao reservatório em um ponto mais acima do ponto de conexão do cano horizontal inferior.
A água preenche todo o sistema, que funciona automaticamente sem o auxílio de bombas hidráulicas, uma vez que a água na tubulação do painel, aquecida pelo Sol, torna-se menos densa e sobe. Ao procurar uma posição mais elevada, ela flui para o reservatório.
Na fase de testes deste painel, a água atingiu, em pouco mais de uma hora, a temperatura de 45°C (muito alta para um banho). Como o aquecedor de baixo custo funcionou surpreendentemente bem, seu construtor desejou divulgar os resultados na internet, tendo o cuidado de transcrever essa temperatura para a escala Fahrenheit, com o intuito de que um internauta, acostumado com esta escala, também fosse capaz de entender rapidamente a informação.
Desse modo, a temperatura que deverá ser divulgada na internet será, em graus Fahrenheit, aproximadamente,
Lembre-se que a equação de conversão entre as escalas Celsius (tC) e Fahrenheit (tF) é dada por

- Química | 2.6 Eletroquímica
(UECE) Para preservar o casco de ferro dos navios contra o efeitos danosos da corrosão, além da pintura são introduzidas placas ou cravos de certo material conhecido como “metal de sacrifício”. A função do metal de sacrifício é sofrer oxidação no lugar do ferro. Considerando seus conhecimentos de química e a tabela de potenciais de redução impressa abaixo, assinale a opção que apresenta o metal mais adequado para esse fim.
