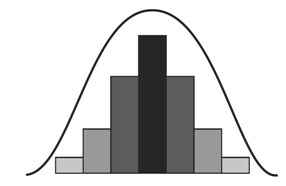
O gráfico mostra a curva de distribuição quantitativa da variação fenotípica para uma determinada característica.
O número de alelos envolvidos na herança desse caráter é:
Questões relacionadas
- Inglês - Fundamental | 10. Can and Can't (Poder e Não Poder, Habilidade)
According to the images below, answer the question.

The _____ can climb trees
- Sociologia | 1. Introdução à Sociologia e Teóricos Clássicos
[1] Estimamos que as mitologias, mais que as ciências e
as filosofias, encerram, junto com as religiões, as grandes
elucidações da essência humana. Aí as culturas, geração após
[4] geração, projetaram grandes visões, acumularam reflexões,
fizeram aprofundamentos e os passaram a seus pósteros.
Souberam usar uma linguagem plástica — com imagens tiradas
[7] das profundezas do inconsciente coletivo — acessível a todas
as idades e a todos os tempos. Além das visões e dos símbolos,
suscitaram e continuam suscitando grandes emoções.
[10] Não é seguro que nós, modernos, com nossa
inteligência instrumental, com nossa tradição de pesquisa
empírica, de crítica e de acumulação de saberes sobre
[13] praticamente tudo, conheçamos mais o ser humano que os
antigos formuladores de mitos. Esses se revelaram
observadores meticulosos e sábios exímios de cada situação e
[16] de cada dobra da existência. Convém revisitá-los, valorizar
suas contribuições e escutar suas lições, sempre atuais.
Leonardo Boff. Saber cuidar: ética do humano — compaixão
pela Terra. Petrópolis: Vozes, 2004, p. 36-7 (com adaptações).
Tendo esse texto como referência inicial, julgue o item
A ideia de “inconsciente coletivo” (l.7) está relacionada ao princípio sociológico básico de que há forças na sociedade que extrapolam as determinações puramente pessoais.
- Química | 3.6 Reações Orgânicas
(MACKENZIE) Abaixo estão representadas as fórmulas estruturais dos compostos A e B, obtidos por meio de duas sínteses orgânicas distintas e em condições adequadas.
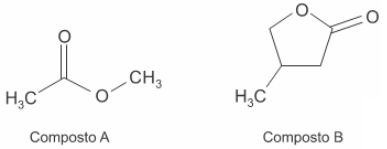
Assim, a alternativa que traz, respectivamente, considerando as condições adequadas para tal, os reagentes orgânicos utilizados na obtenção dos compostos A e B é
- Química | 2.3 Termoquímica
(UEFS)
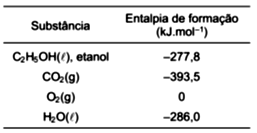
Um motociclista foi de Salvador-BA para Feira de Santana-BA, percorrendo no total 110,0 km. Para percorrer o trajeto, sua motocicleta flex consumiu 5 litros de etanol (C2H5OH, d = 0,8 g.cm-3), tendo um consumo médio de 22,0 km/L.
Com base nos dados de entalpia de formação de algumas substâncias, o calor envolvido na combustão completa por litro de etanol foi, em kJ, aproximadamente:
- Química | 1.3 Classificação Periódica
(UEFS) O elemento químico índio é utilizado na dopagem de cristais, na fabricação de transistores e em soldas de baixo ponto de fusão aplicadas em chips de semicondutores, a exemplo de silício. Com base nos conhecimentos dos modelos atômicos e nas propriedades periódicas dos elementos químicos, é correto afirmar: