(ETE) O gráfico apresenta os valores médios dos preços de terras agrícolas da cidade de Andradina (SP), no período de 2004 a 2014, de acordo com o Instituto de Economia Agrícola (IEA).
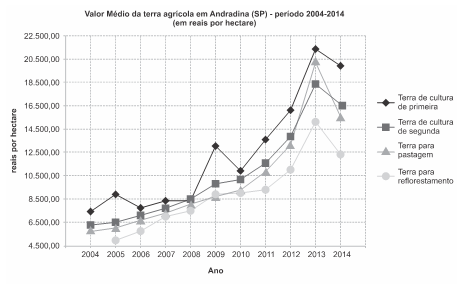
Com base no gráfico, pode-se afirmar corretamente que:
Questões relacionadas
- Ciências da Natureza | Capítulo 10: Substâncias e misturas
Marque com um X as misturas homogêneas.
- Arte | 7. Cultura e Arte Popular
(ENEM 2013 2º APLICAÇÃO)
A foto mostra integrantes de um grupo de choro tocando instrumentos de diferentes classificações. Nessa formação, o instrumento que representa a família
- Matemática | 2.1 Conjuntos
(IME) Dados três conjuntos quaisquer F, G e H. O conjunto G-H é igual ao conjunto:
- Espanhol - Fundamental | 2. Léxico
Lee el texto y observa el término destacado. Pues sí, el 13 de marzo de 1984 llegaba al mercado el primer teléfono móvil de la historia, el Motorola DynaTAC 8000x, un dispositivo que nos permitía hablar por teléfono en cualquier lugar y sin necesidad de estar
- Geografia - Fundamental | 2.01 Os Mapas e Os Instrumentos Cartográficos
O mapa e o globo terrestre são instrumentos fundamentais para representar e entender a Terra. Desde a antiguidade, as pessoas têm buscado formas de representar a Terra e os primeiros mapas conhecidos foram criados pelos babilônios em 600 a.C. e pelos chineses em 200 a.C. Desde então, os mapas evoluíram muito, e hoje temos diversos tipos de projeções e mapas para diferentes fins.
Qual a principal diferença entre um mapa e um globo terrestre?
