A figura abaixo é uma representação dos principais climas que atuam no Brasil.

Considere os seguintes climogramas. Eles representam as médias anuais de temperatura e pluviosidade de três cidades brasileiras entre os anos de 1961-1990.
Questões relacionadas
- Ciências - Fundamental | Não Possui Tópico Definido
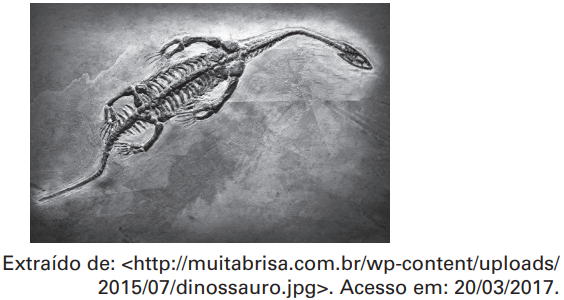
De todos os registros fósseis que contam um pouco da história da vida na Terra, nenhum é mais fascinante do que os que recontam a história dos dinossauros e o seu domínio sobre as espécies da Terra durante um longo tempo.
Os registros fósseis nos dizem que os dinossauros se assemelham aos animais atuais conhecidos como
- Biologia | 4.3 Metabolismo Energético
A etapa (I) __________ da fotossíntese ocorre no estroma dos cloroplastos, sem necessidade direta da luz. Nessa etapa, o CO2 recebe o hidrogênio transportado pelas moléculas de NADPH2 o qual é proveniente da (II) __________ da água. O produto do (III) __________ é, na realidade, um carboidrato de três carbonos, que origina (IV) __________ e (V) __________.
Assinale a alternativa cujos termos preenchem CORRETAMENTE as lacunas.
- Ciências - Fundamental | 11. Os Materiais Artificiais
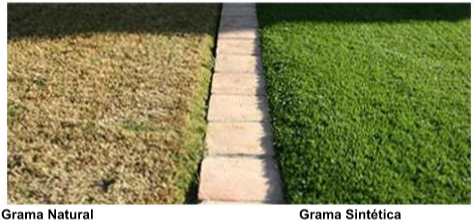
Você já ouviu falar em grama sintética? Não? Pois saiba que ela já vem sendo usada em muitos estádios de futebol, jardins e quadras.
A grama sintética é um material usado para imitar a grama natural. Ela é geralmente utilizada em áreas onde a grama natural não pode crescer ou em áreas onde a manutenção da grama natural é mais é difícil. A grama sintética é mais usada em estádios esportivos e arenas, mas também pode ser usada em playgrounds e outros tipos de espaço.
Disponível em: http://gramagrama.net/tipos-de-grama/grama-sintetica (adaptado).
Acesso em: 24 maio 2012
A) Explique a diferença entre a grama sintética e grama natural.
B) Escreva em que situações a grama sintética está substituindo a grama comum.
- Ciências - Fundamental | Não Possui Tópico Definido
O que pode acontecer com a pele humana quando se expõe excessivamente à luz solar fora dos horários adequados?
- Biologia | 4.4 Núcleo Interfásico e Divisão Celular
A tabela relaciona alguns códons a seus respectivos aminoácidos.

Os dados da tabela permitem concluir que o peptídeo formado pela sequência de aminoácidos (met – ile – cis – gli – fen) foi codificado pelo seguinte trecho de uma das fitas da molécula de DNA: