Os setogramas mostram a Produção Energética Mundial em dois momentos distintos: 1973 e 2005.
Produção Energética Mundial
Porcentagem de energia produzida por cada tipo de combustível
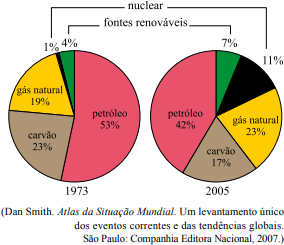
A partir da observação dos gráficos e dos seus conhecimentos pode-se afirmar que
Questões relacionadas
- Língua Portuguesa - Fundamental | 4.09 Dissertação e Argumentação
Katmandu, 10 de fevereiro
Diário,
hoje foi o dia mais sinistro! Fomos passear pelo centro histórico e encontramos homens santos, chamados sadus. Eles têm umas manias bem esquisitas. Cobrem o corpo com cinza e ficam meditando em umas posições difíceis de se equilibrar. A vovó explicou que são posições de ioga. Os sadus de verdade andam quase pelados (e ninguém liga). Tinha um sadu que devia ser meio falsificado porque estava todo vestido e em troca de umas moedas deixava os turistas tirarem foto ao lado dele. Era um “santo” para turista ver. O cabelo desse sadu era tão comprido que ia da cabeça (como todo cabelo) até a ponta do pé e ainda sobrava um pedacinho que arrastava no chão. Era muito feio. Pente não passava por ali fazia anos.
Depois encontramos uns encantadores de serpente. É, eles existem mesmo, não é só em filme. Queria que o Davi, o Pedro, os dois meninos mais legais da minha escola, e o Diego, meu irmão, vissem isso. Eles iam achar muito irado. Os homens guardavam as serpentes em cestinhas de palha. Tinha um encantador de serpentes que tocava uma flauta e da cestinha dele aparecia uma naja. (...)
Tinha um menino segurando umas cobras muito enroladas umas nas outras. Elas estavam emboladas como os fios do computador da minha mãe. Eu só soube que eram três porque contei três cabeças.
E o mais incrível era um homem com uma jiboia imensa e gorda e comprida (se ela desenrolasse toda, ficaria maior do que eu). Fiquei de boca aberta. O homem da jiboia ofereceu a cobra para a minha vó segurar. E se a cobra entrangulasse a vovó? (...) mas voltando à cena da jiboia... minha vó é toda metida a esperta e já estava sorrindo, pensando no sucesso que ia ser mostrar para a turma da hidroginástica a foto dela com uma cobra a tiracolo. Mas na hora H, na hora de estender a mão e segurar o bicho, ela ficou com medo e escapou de virar lanche de jiboia. E eu escapei de ficar órfã de vó no meio do Nepal.
Como eu e Julia adoramos as cobras e não parávamos de falar nisso, a vovó entrou numa livraria e comprou um livro formidável: Tudo o que você queria saber sobre as cobras, com um monte de figuras espetaculares. Sentamos num restaurante para tomar coca-cola (coca-cola tem no mundo todo), começamos a ler o livro e descobrimos... toda a verdade verdadeira. Eu tinha razão: a cobra pescoçuda era uma naja, a cobra preferida dos encantadores de serpente – yes! Garota inteligente! Mas... essa história de encantamento é tudo mentira, uma lorota boa. Sabe por quê? As cobras não têm ouvidos, são surdinhas da silva xavier.
- Mas nós vimos a naja aparecendo quando o encantador tocou a música! – disse Júlia.
- Porque os encantadores de serpentes botam em suas flautas xixi de rato, e quando eles sopram deve sair muito cheiro de rato pelo ar. Aí, as cobras ficam doidinhas e saem das cestinhas colocando as linguinhas fininhas e compridas para dentro e para fora, pois é assim que elas sentem cheiros – respondeu a vovó lendo a explicação do livro.
(...)
Continuamos andando e encontramos umas mulheres vendendo carimbos e pós coloridos. Nós ficamos malucas e compramos um monte. Os carimbos daqui são feitos de madeira (incríveis, minhas amigas vão morrer de inveja!), nada parecido com aqueles de plástico, que a gente acha em qualquer barraca de camelô. (...) Os pós coloridos eram para tingir panos.
Depois, adivinha que sorte: no meio da rua tinha um nepalês (quem nasce no Nepal se chama assim) fazendo tatuagens de hena na mão das pessoas com os mesmos carimbos que nós tínhamos acabado de comprar. A gente implorou para a vovó e ela deixou nós duas fazermos tatuagens. Adoro tatuagem, é muito radical. Em cada dedo, o moço tatuou uma flor com cabinho, e na palma da mão, um símbolo estanho.
Esqueci de contar que para fazer as compras a vovó tinha trocado dinheiro. Cada país tem o seu dinheiro, mas existe o dólar, o dinheiro mais usado do mundo. Em todos os lugares a gente pode trocar dólares pelo dinheiro local. A vovó trouxe uma porção deles e ela vai trocando aos pouquinhos pelo dinheiro do país onde a gente está. A moeda do Nepal se chama rúpia nepalesa.
E sabe o que mais nós compramos com as nossas rúpias? Marionetes. Tinha uma loja cheia delas (marionetes são bonecos que mexem os braços, as pernas e a cabeça quando a gente puxa os fios). Vou enfeitar o meu quarto com todas que escolhi.
Luisa
(Fonte: CHINDLER, Daniela. O hamburguer era de carneiro – diário de uma viagem à Índia. Rio de Janeiro, Rocco, 2004. )
Dê a sua opinião:
a) Por que foi preciso implorar para a avó deixar que elas fizessem tatuagens? Quais poderiam ser as razões da avó para não deixá-las fazer tatuagens?
b) CITE dois argumentos que poderiam ter sido usados pelas meninas para convencer a avó a dar a sua permissão.
- Matemática | 1.11 Produtos Notáveis e Fatoração
(UTFPR) Simplificando a expressão
 com x ≠ y obtém-se:
 - Ciências - Fundamental | Não Possui Tópico Definido
Os golfinhos apresentam visão aguçada, mas para sua locomoção em ambientes de baixa luminosidade sua visão se mostra insuficiente. Nesse caso eles fazem uso de seu biossonar ou ecolocalização, o que os permite “enxergar” sem usar os olhos.
Esse processo consiste na emissão de sons de frequência de cerca de 150 kHz e subsequente recepção do som refletido.
Um mergulhador em água salgada, onde o som se propaga com velocidade de 1500 m/s, sendo ecolocalizado por um golfinho que se encontra a uma distância de 3 m dele
- Matemática | 15.3 Circunferência
A circunferência que tem seu centro no ponto
e é tangente à reta de equação
tem equação dada por:
- Matemática | 1.05 Sistema Métrico e Base Decimal
(ENEM 2020 1° APLICAÇÃO) Um hotel de 3 andares está sendo construído. Cada andar terá 100 quartos. Os quartos serão numerados de 100 a 399 e cada um terá seu número afixado à porta. Cada número será composto por peças individuais, cada uma simbolizando um único algarismo.
Qual a quantidade mínima de peças, simbolizando o algarismo 2, necessárias para identificar o número de todos os quartos?
