O gráfico abaixo mostra a variação da inflação mensal no Brasil em 2015, segundo o IPCA.
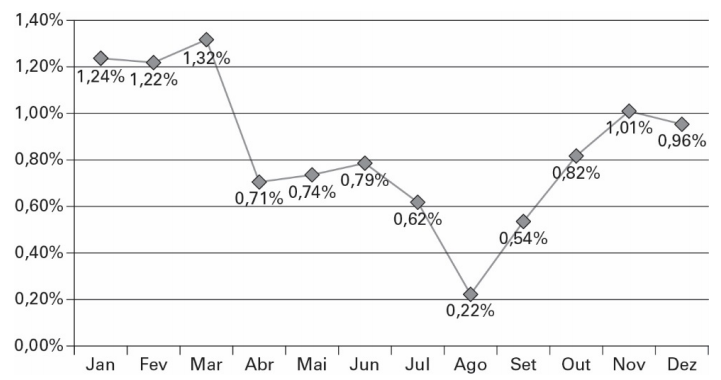
A diferença entre o maior valor apresentado no gráfico e o menor valor apresentado no gráfico é de:
Questões relacionadas
- História | A. Grécia
[1] Está previsto para junho o primeiro teste da Ares,
família de foguetes que permitirá a aposentadoria do ônibus
espacial e que, eventualmente, levará o homem de volta à
[4] Lua até 2020. Esse teste promete ser uma das sensações
do ano por várias razões. Uma delas é a expectativa ruim que
tem envolvido o programa. Até agora chegaram ao
[7] conhecimento do público, principalmente, os problemas que
os engenheiros estão encontrando. Mas, em uma de suas
raras aparições públicas, o administrador da NASA, Mike
[10] Griffin, contra-atacou dizendo que, “diferentemente do que
se afirma em alguns blogs e sites, o desenvolvimento da Ares
vai muito bem.”
[13] Se o lançamento do protótipo da Ares realmente
vier a ocorrer como previsto, tem tudo para ser, se não um
sucesso retumbante, um alento para quem sonha com a
[16] ocupação humana do nosso satélite natural.
Galileu. São Paulo: Globo, n.º 210, jan./2009, p.12 (com adaptações).
Considerando os sentidos e as estruturas linguísticas do texto acima bem como suas implicações, julgue o item.
Considerando-se que Ares, na mitologia grega, era o deus da guerra, é correto inferir que há pretensões bélicas na missão aeroespacial assim denominada.
- Geografia - Fundamental | B. Industrialização Brasileira
Leia o trecho a seguir.
A indústria brasileira começou a se concentrar no estado de São Paulo no período que vai de 1907 a 1920. Em 1920, já participava com mais de 30% do número de indústrias do país. A distribuição espacial das indústrias brasileiras em São Paulo foi determinada pelo processo histórico, ocorrido ao longo do século 20 (Adaptado).
Disponível em: http://noss2geografia.blogspot.com/2012/02/concentracao-industrial.html. Acesso em: 06 fev. 2012.
A concentração industrial em São Paulo foi favorecida pelo
- Matemática - Fundamental | 3.3 Multiplicação e Divisão de Números Racionais
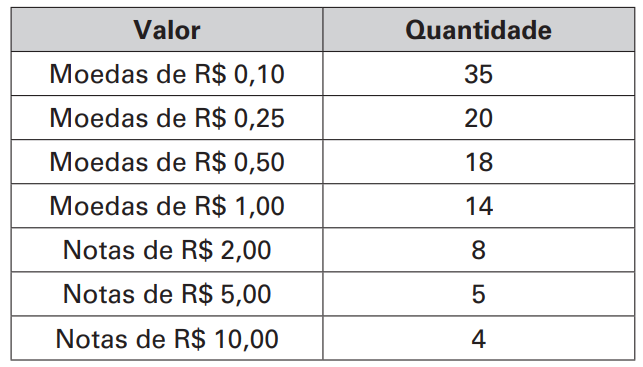
Pedro decidiu abrir o seu cofrinho, onde ele guardou moedas e cédulas de papel durante um ano. Ao fazer a contagem, ele percebeu que tinha as quantidades de notas e moedas indicadas na tabela a seguir.
Depois de juntar todo o dinheiro, ele comprou um artigo que custava R$ 95,40. Depois dessa compra, quantos reais sobraram com Pedro?
- Língua Portuguesa - Fundamental | 9.01 Texto narrativo
Pássaros que vivem na cidade são mais inteligentes e saudáveis do que os silvestres As dificuldades das cidades podem ter deixados os animais mais atentos Uma pesquisa realizada pela universidade canadense McGill apontou que pássaros que vivem na cidade são mais espertos do que seus primos rurais - e também têm uma saúde melhor. O estudo analisou 53 pássaros da espécie Loxigilla barbadensis. Os animais foram capturados em 8 pontos diferentes da ilha de Barbados, alguns mais e outros menos urbanizados. Os pássaros, então, foram submetidos a testes que verificavam como eles lidavam com desafios de inteligência e como estava seu sistema imunológico. Pois os animais urbanos se deram melhor em todas as etapas do estudo. [...] Mas a grande surpresa do estudo foi a saúde dos pássaros da cidade. Os animais tinham um sistema imunológico superior ao dos animais selvagens. "Como os pássaros urbanos foram melhores na resolução de problemas, nós esperávamos que aconteceria uma troca e que a imunidade deles seria mais baixa, só porque presumimos que não se pode ser bom em tudo. Parece que, nesse caso, os pássaros da cidade vencem em tudo”, afirmou em comunicado Jean-Nicolas Audet, estudante de biologia da universidade e autor do projeto. Os pesquisadores acreditam que os resultados sejam melhores para os pássaros da cidade porque eles estão em constante contato com situações adversas, como constante mudança nos alimentos encontrados, perturbação humana e doenças. Todos esses problemas acabaram selecionando os indivíduos mais fortes. Disponível em: http://super.abril.com.br/ciencia/passaros-que-vivem-na-cidade-sao-mais-inteligentes-e-saudaveis-do-que-os-silvestres . Acesso em: 26 maio 2016.
Enunciado:
a) Releia os trechos a seguir, dando o significado das palavras e expressões destacadas. Procure descobrir esses significados pelo contexto em que elas foram usadas.
Os animais foram capturados em 8 pontos diferentes da ilha de Barbados.
Capturados: -----------------------------------------------------------------------------------------------------------------------------------------------
Situações adversas: -------------------------------------------------------------------------------------------------------------------------------------
b) O título dessa reportagem é:
Pássaros que vivem na cidade são mais inteligentes e saudáveis do que os silvestres
Na sua opinião, por que os pássaros da cidade conseguiram demonstrar que são mais inteligentes do que os animais silvestres?
- Língua Portuguesa - Fundamental | 4.12 Textos do Dia a Dia: Classificados
Observe a pintura de Jean-Baptiste Debret, sobre o trabalho escravo no século XIX, e a fotografia de Márcia Folleto, de 2015, que acompanha uma reportagem sobre a situação do negro no Brasil.
Compare as duas imagens e justifique o que mudou e o que permanece igual nesse tempo em relação à escravidão e à desigualdade.