(FUVEST 2018 1ª FASE)
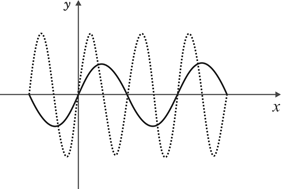
Admitindo que a linha pontilhada represente o gráfico da função f(x) = sen(x) e que a linha contínua represente o gráfico da função g(x) = αsen(βx) segue que
Questões relacionadas
- Espanhol - Fundamental | Não Possui Tópico Definido
El profesor llevó la siguiente adivinanza a la clase para enseñar las profesiones a sus alumnos.
Disponible en < https://pt.scribd.com/doc/14810546/adivinanzas-de-oficios>. Acceso el: 09 jan. 2019.
La respuesta de la adivinanza es
- Biologia | 3.2 Carboidratos, Lipídios, Proteínas e Enzimas
Em um mercado popular foram encontrados produtos alimentares de diversas origens e que formam a base da alimentação humana. Alguns destes produtos estão listados na tabela.
Dos produtos citados na tabela, são ricos em proteínas e lipídios
- Química | 1.1 Introdução à Química
A bauxita é o minério utilizado na fabricação do alumínio, a qual apresenta Al2O3 (alumina) em sua composição. Após o trituramento e lavagem para reduzir o teor de impurezas, o minério é misturado a uma solução aquosa de NaOH (etapa A). A parte sólida dessa mistura é rejeitada e a solução resultante recebe pequenos cristais de alumina, de onde sedimenta um sólido (etapa B). Esse sólido é aquecido até a obtenção de um pó branco, isento de água e constituído unicamente por alumina. Finalmente, esse pó é aquecido até sua fusão e submetido a uma eletrólise, cujos produtos são o metal puro fundido (Al) e o gás carbônico (CO2).
SILVA FILHO, E. B.; ALVES, M. C. M.; DA MOTTA, M. Lama vermelha da indústria de beneficiamento de alumina: produção, características, disposição e aplicações alternativas.
Nesse processo, as funções das etapas A e B são, respectivamente,
- Física
Uma partícula carregada negativamente está se movendo na direção +x quando entra em um campo elétrico uniforme atuando nessa mesma direção e sentido. Considerando que sua posição em t = 0 s é x = 0 m, qual gráfico representa melhor a posição da partícula como função do tempo durante o primeiro segundo?

- Ciências - Fundamental | Não Possui Tópico Definido
As bactérias são seres microscópicos que não podemos ver a olho nu, mas que podem estar presentes em vários lugares do nosso cotidiano, como em superfícies, alimentos e até mesmo em nossas mãos. Essas pequenas criaturas podem nos deixar doentes, mas felizmente podemos nos proteger delas através de medidas simples, como lavar as mãos com frequência e manter a higiene em nossas casas e ambientes de convivência.
Quais as principais espécies de bactérias que podem estar presentes em alimentos? Explique como ocorre a contaminação com essas bactérias e como podemos prevenir a intoxicação alimentar causada por elas.