Depois de jogar um dado em forma de cubo e de faces numeradas de 1 a 6, por 10 vezes consecutivas, e anotar o número obtido em cada jogada, construiu-se a seguinte tabela de distribuição de frequências.
| Número obtido | Frequência |
| 1 | 4 |
| 2 | 1 |
| 4 | 2 |
| 5 | 2 |
| 6 | 1 |
A média, mediana e moda dessa distribuição de frequências são, respectivamente:
Questões relacionadas
- Biologia | 12.2 Cadeia e Teias Alimentares, Pirâmides e Energia
(Uepb) A decomposição é um dos processos naturais de extrema relevância ao equilíbrio e funcionamento da natureza. No diagrama abaixo lemos a distribuição da biomassa dos três principais grupos de organismos que participam ativamente no processo de decomposição nos diferentes biomas do planeta. Baseado neste conhecimento e na figura, assinale V para verdadeiro e F para falso nos três blocos de questões abaixo.

I. Sobre o papel dos fungos e bactérias no processo de decomposição nos ecossistemas:
( ) A biomassa dos fungos e bactérias é muito baixa nos biomas de temperaturas extremas.
( ) O baixo acúmulo de matéria orgânica no solo dos desertos é a causa da baixa biomassa de fungos e bactérias.
( ) Os hifomicetos são os principais grupos de fungos nos ecossistemas aquáticos.
II. Sobre a atuação da Macrofauna no processo de decomposição:
( ) Seus representantes são exclusivamente detritívoros.
( ) A baixa taxa de decomposição da serapilheira nas florestas tropicais é causa da alta biomassa da macrofauna.
( ) Tende a reduzir em regiões frias.
III. Sobre a decomposição como serviço ecossistêmico:
( ) A decomposição se processa sobre a mineralização de alguns nutrientes em particular.
( ) A temperatura é um fator controlador da taxa de decomposição nos biomas.
( ) Os decompositores são a base alimentar de todas as cadeias tróficas.
A sequência correta das assertivas é
- Biologia | 10.4 Artrópodes e Equinodermos
A coluna da esquerda, abaixo, lista dois grupos dos Artrópodos; a da direita, características que os distinguem.
Associe adequadamente a coluna da direita à da esquerda.
1. Insetos
( ) respiração branquial
2. Crustáceos
( ) desenvolvimento direto e indireto
( ) glândulas antenais
( ) três pares de pernas
A sequência correta de preenchimento dos parênteses, de cima para baixo, é
- História - Fundamental | 01. A Primeira República no Brasil
Texto base: Leia o texto a seguir. Aqui estou, como de outras vezes, para compartilhar as vossas comemorações e testemunhar o apreço em que tenho o homem de trabalho como colaborador direto da obra de reconstrução política e econômica da Pátria. [...]. A despeito da vastidão territorial, da abundância de recursos naturais e da variedade de elementos de vida, o futuro do país repousa, inteiramente, em nossa capacidade de realização. Todo trabalhador, qualquer que seja a sua profissão, é, a este respeito, um patriota que conjuga o seu esforço individual à ação coletiva em prol da independência econômica da nacionalidade. O nosso progresso não pode ser obra exclusiva do Governo, sim de toda a Nação, de todas as classes, de todos os homens e mulheres que se enobrecem pelo trabalho, valorizando a terra em que nasceram. BARROS, Edgard Luiz de. Getúlio!. São Paulo: Nankin, 2004. p. 97-98.
Enunciado:
a) Analise as relações entre Vargas e os trabalhadores no Brasil, destacando como ele procurava se apresentar a eles.
b) Identifique quais argumentos que Vargas usava para conseguir o apoio dos trabalhadores.
- Matemática - Fundamental | 3.3 Centena
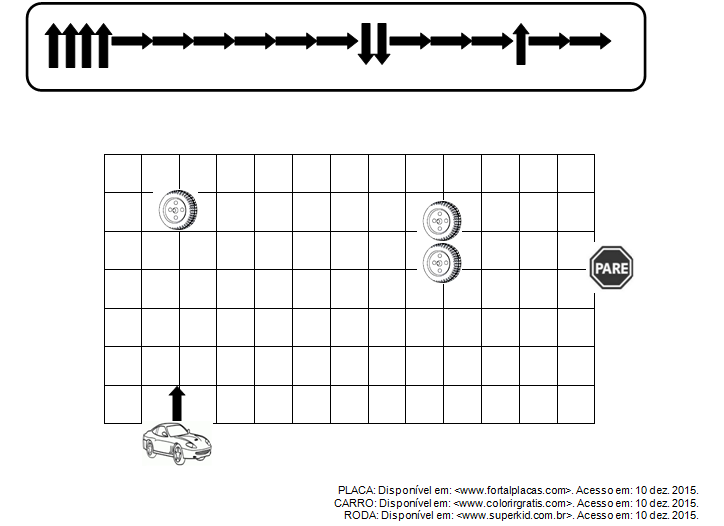
Texto base: Observe a sequência das setas e indique o caminho para que o carrinho chegue até a placa de pare. Você deverá desenhar as setas de acordo com esta sequência.
Enunciado:
- História | A. Grécia
(UFSM) Hades, o deus dos infernos, apaixonou-se por Perséfone, filha de Deméter, a deusa da fertilidade. Hades tomou a jovem e puxou-a para dentro do seu carro. Logo depois, abriu uma fenda na terra, mergulhando com sua presa para as profundezas. Deméter passou a procurar a filha e descuidou da natureza, prejudicando as plantações e os pastores. Zeus preocupou-se com o desespero de Deméter e permitiu que ela descesse à mansão dos mortos. Deméter não conseguiu arrancar Perséfone de Hades, mas negociou com ele a permissão da filha ficar metade do ano com a mãe, a outra metade com o esposo. Desde então, quando Perséfone está na superfície, a natureza viceja e, quando ela retorna aos infernos, a Terra fica estéril.
Fonte: FRANCHINI, S.A. As grandes histórias da mitologia greco-romana. POA: L&PM, 2012. p. 38-39. (adaptado)
O mito de Perséfone permite concluir que