(EEAR) O gráfico que melhor representa a expansão de uma amostra de gás ideal a pressão constante é:
Considere:
1. a temperatura (T) dada em kelvin (K)
2. V= volume.
Questões relacionadas
- Biologia | 8.2 Vírus e Viroses
Sobre a chikungunya, é correto afirmar-se que
- Química | 2.4 Cinética Química
(UNIT)
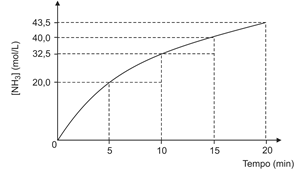
O gráfico mostra a variação de concentração de amônia em função do tempo da reação de nitrogênio, N2(g), com hidrogênio, H2(g), em determinadas condições.
Uma análise desse gráfico permite corretamente afirmar:
- Biologia | 01. Introdução à Biologia
(UFRGS) Numa experiência controlada o grupo controle tem por objeto
- História
O Islamismo – religião pregada por Maomé e seus seguidores – tem hoje mais de 1 bilhão de fiéis espalhados pelo mundo, sendo ainda predominante no Oriente Médio, região onde surgiu. Um dos principais fundamentos da expansão muçulmana é a Guerra Santa. A respeito dos muçulmanos, é correto afirmar que
- Física | 3.4 Transmissão de Calor
A garrafa térmica tem como função manter seu conteúdo em temperatura praticamente constante durante um longo intervalo de tempo. É constituída por uma ampola de vidro cujas superfícies interna e externa são espelhadas para impedir a propagação do calor por __________. As paredes de vidro são más condutoras de calor evitando-se a __________ térmica. O vácuo entre as paredes da ampola dificulta a propagação do calor por ___________ e ____________.Marque a alternativa que completa o texto corretamente: