(Uefs)

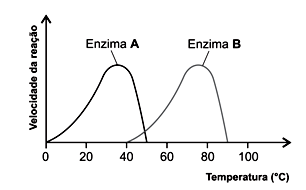
O gráfico representa a variação da velocidade de reação em relação à variação da temperatura do ambiente de duas classes distintas de enzimas.
Considerando-se a análise das informações contidas no gráfico, pode-se inferir que
Questões relacionadas
- Língua Portuguesa - Fundamental | 1.02 Variedades Linguísticas
Texto base: Para Carr, internet atua no comércio da distração Autor de “A Geração Superficial” analisa a influência da tecnologia na mente O jornalista americano Nicholas Carr acredita que a internet não estimula a inteligência de ninguém. O autor explica descobertas científicas sobre o funcionamento do cérebro humano e teoriza sobre a influência da internet em nossa forma de pensar. Para ele, a rede torna o raciocínio de quem navega mais raso, além de fragmentar a atenção de seus usuários. Mais: Carr afirma que há empresas obtendo lucro com a recente fragilidade de nossa atenção. “Quanto mais tempo passamos on-line e quanto mais rápido passamos de uma informação para a outra, mais dinheiro as empresas de internet fazem”, avalia. “Essas empresas estão no comércio da distração e são experts em nos manter cada vez mais famintos por informação fragmentada em partes pequenas. É claro que elas têm interesse em nos estimular e tirar vantagem da nossa compulsão por tecnologia.” ROXO, E. Folha de S. Paulo, 18 fev. 2012 (adaptado).
Enunciado:
A crítica do jornalista norte-americano que justifica o título do texto é a de que a internet
- Matemática | 09. Probabilidade
O organizador de uma competição de lançamento de dardos pretende tornar o campeonato mais competitivo. Pelas regras atuais da competição, numa rodada, o jogador lança 3 dardos e pontua caso acerte pelo menos um deles no alvo. O organizador considera que, em média, os jogadores têm, em cada lançamento, de probabilidade de acertar um dardo no alvo.
A fim de tornar o jogo mais atrativo, planeja modificar as regras de modo que a probabilidade de um jogador pontuar em uma rodada seja igual ou superior a Para isso, decide aumentar a quantidade de dardos a serem lançados em cada rodada.
Com base nos valores considerados pelo organizador da competição, a quantidade mínima de dardos que devem ser disponibilizados em uma rodada para tornar o jogo mais atrativo é
- História | 3.5 Nova

Disponível em: http://une.org.br. Acesso em: 30 jul. 2015 (adaptado).
Considerando o funcionamento do regime democrático, o episódio retratado na imagem está associado ao(à)
- Física | 3.6 Termodinâmica
(UPE) Um gás ideal está confinado dentro de um cilindro de comprimento H e área de seção transversal A. Dentro do cilindro, n moles do gás são mantidos a uma temperatura constante T. A base do cilindro é condutora e possui comprimento H com condutividade térmica k. A outra extremidade do cilindro está conectada a um reservatório térmico mantido a uma temperatura To< T. O pistão, de massa desprezível, é movido de forma que o fluxo de calor na barra é constante. Considere a constante universal dos gases perfeitos igual a R. Então, o módulo da velocidade do pistão após ele ter percorrido uma distância igual a H/2 é

- Geografia | 7. Geopolítica
Após o ataque terrorista em 11 de setembro de 2001, o governo dos Estados Unidos publicou um documento que sistematizava as novas diretrizes para a estratégia de segurança nacional. Essas orientações político-militares, mas também econômicas, que levaram à guerra no Afeganistão em 2002 e no Iraque em 2003, ficaram conhecidas como Doutrina