O gráfico compara a velocidade de crescimento, em centímetros ao ano, de meninos e meninas dos 7 aos 18 anos de idade.
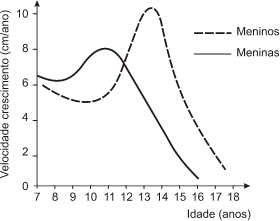
Analisando o gráfico, pode-se concluir que
Questões relacionadas
- Matemática | 15.3 Circunferência
No sistema usual de coordenadas cartesianas, a equação da circunferência inscrita no quadrado representado pela equação | x | +| y | = 1 é
- Geografia | 3.5 Vegetação
TEXTO I
O uso do Cerrado pelas populações indígenas estava ligado a um caráter conservacionista e sagrado. A caça e a pesca eram realizadas apenas para a subsistência. A coleta recolhia apenas o que o Cerrado oferecia. A agricultura com a produção de milho e tubérculos abria apenas alguns clarões nas áreas de florestas decíduas. O Cerrado era o fundamento central da existência dessas tribos. Isso significa a sacralização dos elementos deste bioma pelos grupos indígenas.
SILVA, E. B. D.; BORGES, J. A. Dos usos e reocupações do Cerrado goiano: agroecologia como alternativa. XI EREGEO, Jataí-GO, 2009 (adaptado).
TEXTO II
O desenvolvimento sustentável é aquele que atende às necessidades do presente sem comprometer a capacidade de as gerações futuras atenderem suas próprias necessidades.
COMISSÃO das Nações Unidas sobre Meio Ambiente e Desenvolvimento. Nosso futuro comum [Relatório Brundtland]. Rio de Janeiro: Fundação Getúlio Vargas, 1988.
Qual característica presente no Texto II amplia a concepção de conservação ambiental apresentada no Texto I?
- Matemática | 1.05 Sistema Métrico e Base Decimal
Atendendo à encomenda de um mecânico, um soldador terá de juntar duas barras de metais diferentes. A solda utilizada tem espessura de 18 milímetros, conforme ilustrado na figura.
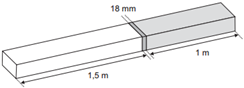
Qual o comprimento, em metros, da peça resultante após a soldagem?
- Geografia - Fundamental | 6.03 América do Sul e os Países Latino-americanos
Leia o título da reportagem a seguir:
Estudo comprova que desmatamento da Amazônia afeta chuvas até na Argentina
A perda de floresta tropical pode afetar pessoas a milhares de quilômetros de distância, de acordo com um novo estudo.
Disponível em: <www.bbc.com/portuguese/noticias/2012/09/120908_amazonia_rp.shtml>.
Acesso em: 28 set. 2017.
O impacto do desmatamento da Floresta Amazônica sobre o volume de chuvas até em áreas distantes da região, como é o caso da Argentina, se dá devido
- Biologia | 12.4 Relações Ecológicas
Num determinado lago, a quantidade dos organismos do fitoplâncton é controlada por um crustáceo do gênero Artemia, presente no zooplâncton. Graças a esse equilíbrio, a água permanece transparente. Depois de um ano muito chuvoso, a salinidade do lago diminuiu, o que permitiu o crescimento do número de insetos do gênero Trichocorixa, predadores de Artemia. A transparência da água do lago diminuiu.
Considere as afirmações:
I. A predação provocou o aumento da população dos produtores.
II. A predação provocou a diminuição da população dos consumidores secundários.
III. A predação provocou a diminuição da população dos consumidores primários.
Está correto o que se afirma apenas em